Senior Design Project
To round out our Mechanical Engineering degree, my team and I tackled an intriguing final capstone project. We set out to solve a problem plaguing collegiate car racing teams all around the globe (well I’m pretty sure).

The Purdue Electric Car racing team (PER) needed a way to test the suspension system of their car without driving it on a track. Before our project, the team designed very conservative suspension members to prevent any on-track catastrophes. As you could imagine, this left a lot of speed and performance on the table in the name of safety. One of my group members was a design lead for the team previously and suggested the idea. The image below provides some foreshadowing for what our design ultimately became.

For this project, I was primarily the electronics lead, designing most of the circuitry, calibrating sensors, and building the user interface. That being said, I’m still going to highlight the mechanical design and the engineering decisions that went into the end product. As a quick intro, the following video I made showcases our final result. The rest of this page then goes into a lot more detail and our presentation poster is included at the end.
To solve this problem we needed to utilize our $1000 budget to create a device that could analyze deflections under specified normal (vertical) and lateral loads at different steering angles. The exact engineering requirements ended up as the following:
Apply controlled loading to wheel hub
– 1000 Newtons of force vertically / 4000 Newtons laterally
Allow for steering adjustability
– ±15° steering angle
Measure suspension system response
– Member strain and wheel kinematics
Given the lack of knowledge I (as well as several other team members) had on car suspension, this project gave the opportunity for plenty of learning.

Design Phase – Mechanical
To reduce complexity and stretch our budget, we made several design concessions early on. First, the team decided to make a quarter-car testing rig (only test on one wheel at a time). Then we chose to connect directly to the wheel hub rather than leaving the wheel attached (reduce issues with wheel deflection and connecting to a rubber wheel).

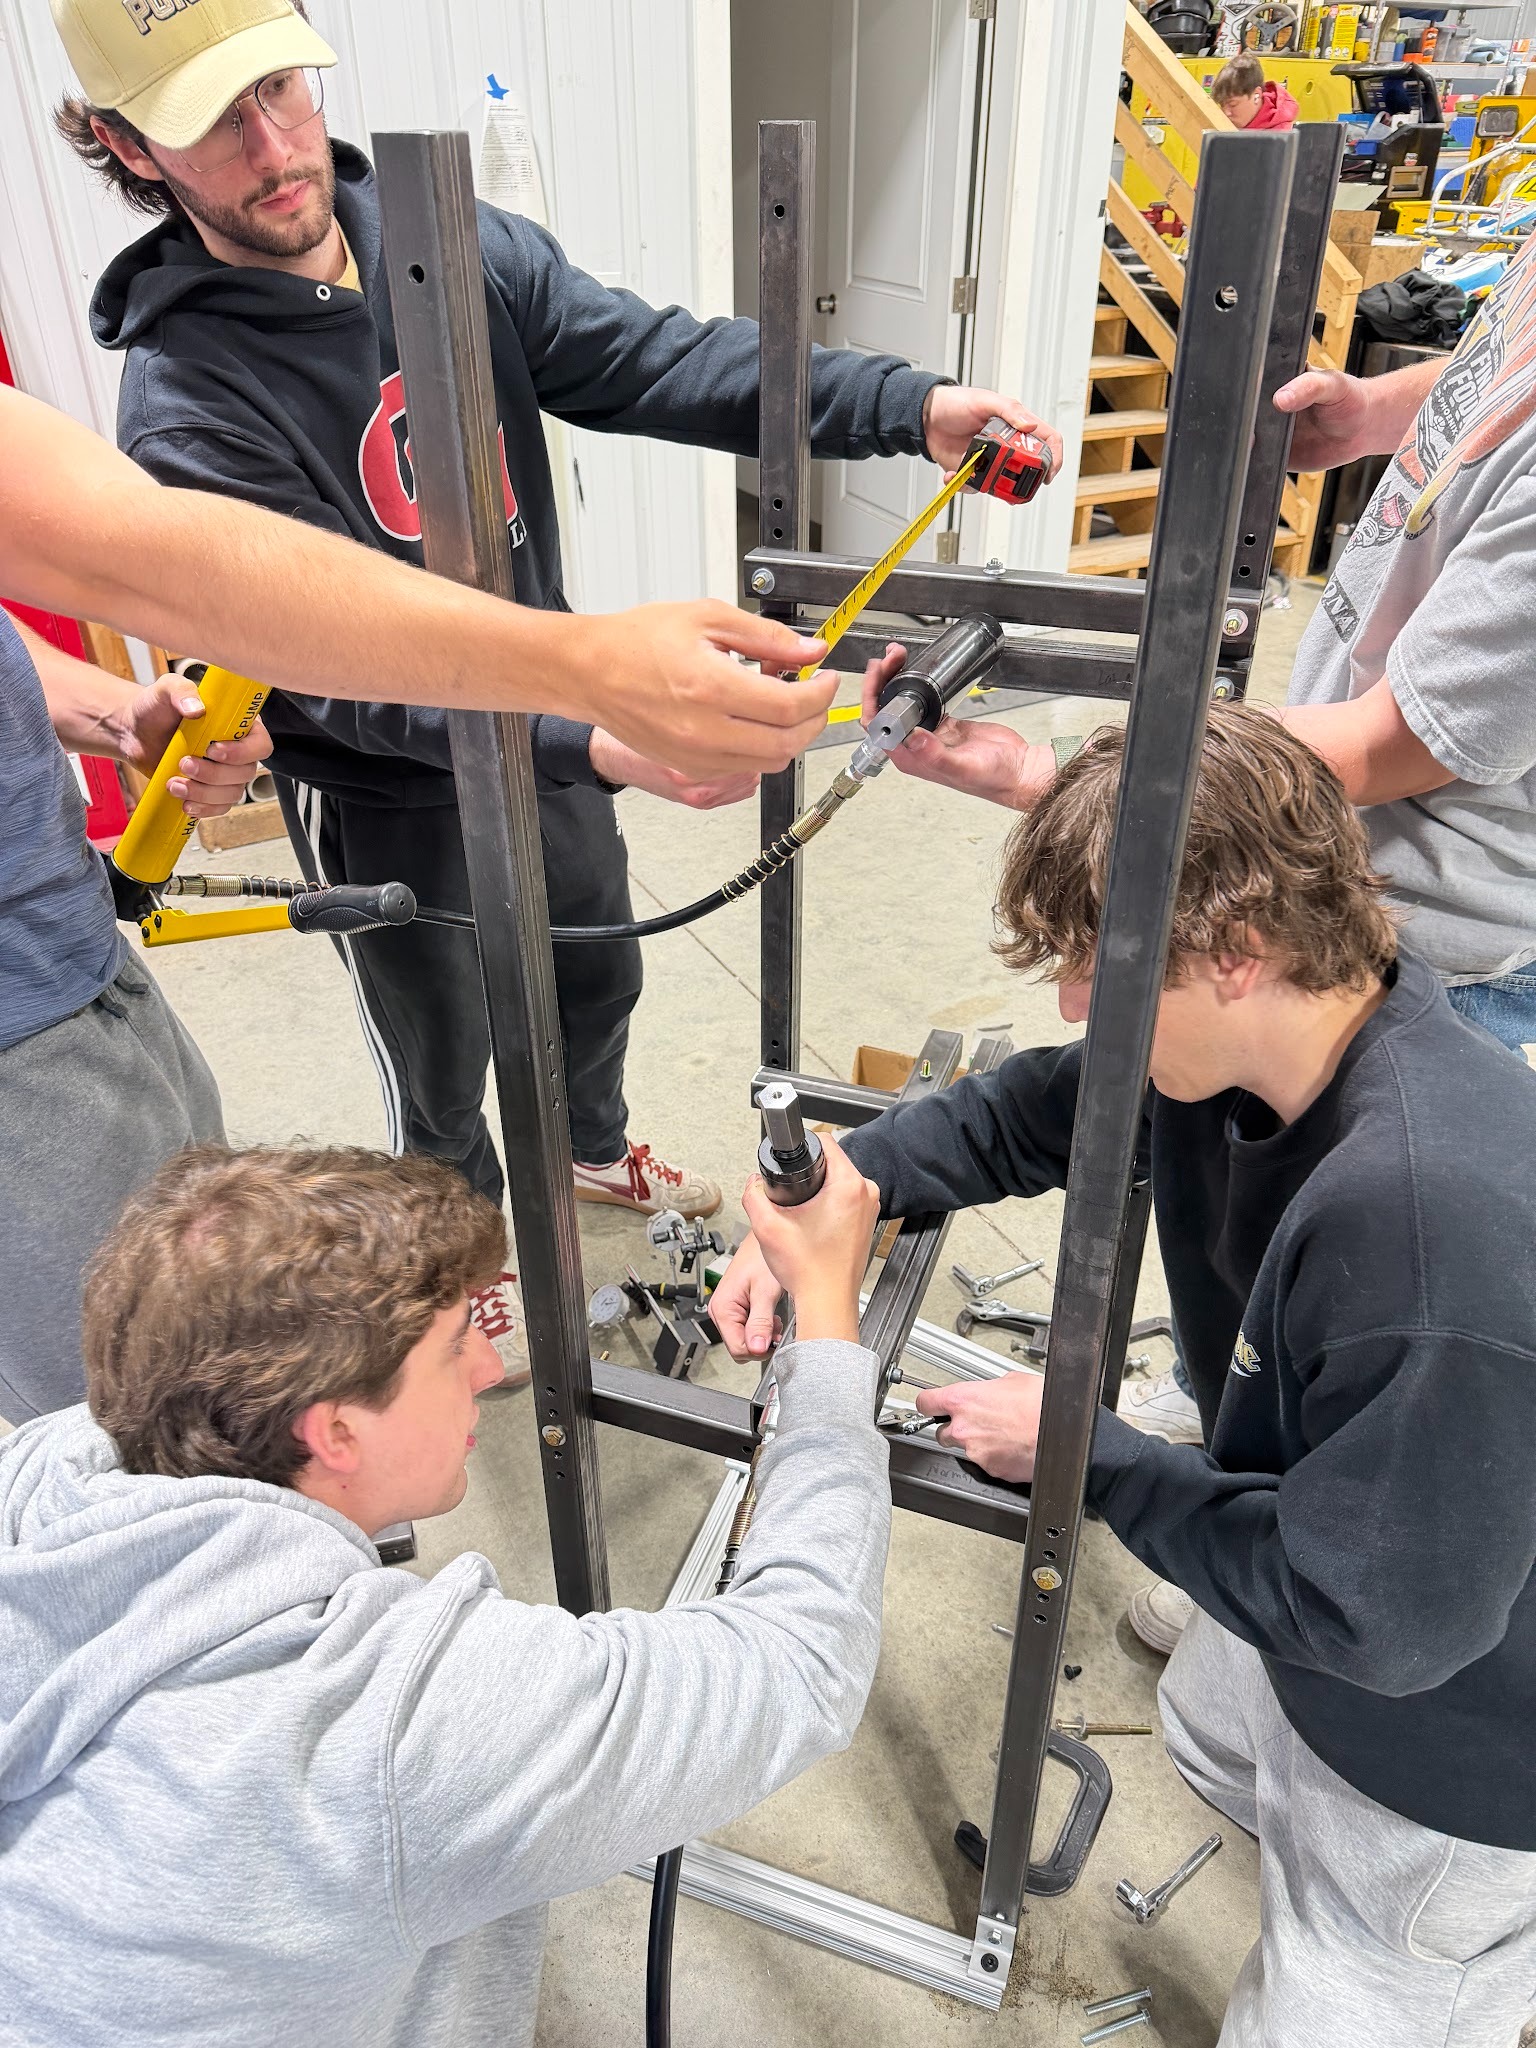
To apply these forces we needed an actuator that could reliably supply very high forces (4000N ≈ 900 lbs). A traditional linear screw actuator was several hundred dollars so instead we went with a hydraulic cylinder that could be manually pumped.
A special mounting plate was designed to allow for deflection and movement while forces were applied in both directions. Part of the novelty in this project is that no other existing suspension test rig of this size can apply forces in two directions. This allows the ability to test “cornering,” which subjects the suspension to the lateral forces it undergoes when turning.


During this phase we did a lot of finite element analysis (FEA) to make sure the whole rig wouldn’t just collapse when we started applying the forces. I did most of the frame FEA in Fusion 360 which was a fun new skill for me.


Design Phase – Electronics
For the electronics design, I ultimately landed on this circuit. The goal was to have two load cells to measure the actuator forces and then 6 strain gauges to measure the strain on each of the suspension members. To accomplish this, I used an Arduino Mega as the microcontroller and 8 HX711 chips to amplify the raw voltage signals from the 8 sensors. This was a bit ambitious and ended up with a design that needed 64 wires (I color coded them too). Two 5-connector WAGO boxes were added for common ground and 5V voltage signals to reduce sensor variability.

I also created a custom circuit box in Fusion 360 to house all of these components. The box has a recessed lid and little pins that fit into the holes on each chip and hold them in place without any glue or other fasteners.


The following shows our final bill of materials (BOM). We were able to accomplish it all slightly under budget (well some additional costs may have been paid for out of our own pockets but nothing excessive).

Build/Test Phase – Mechanical
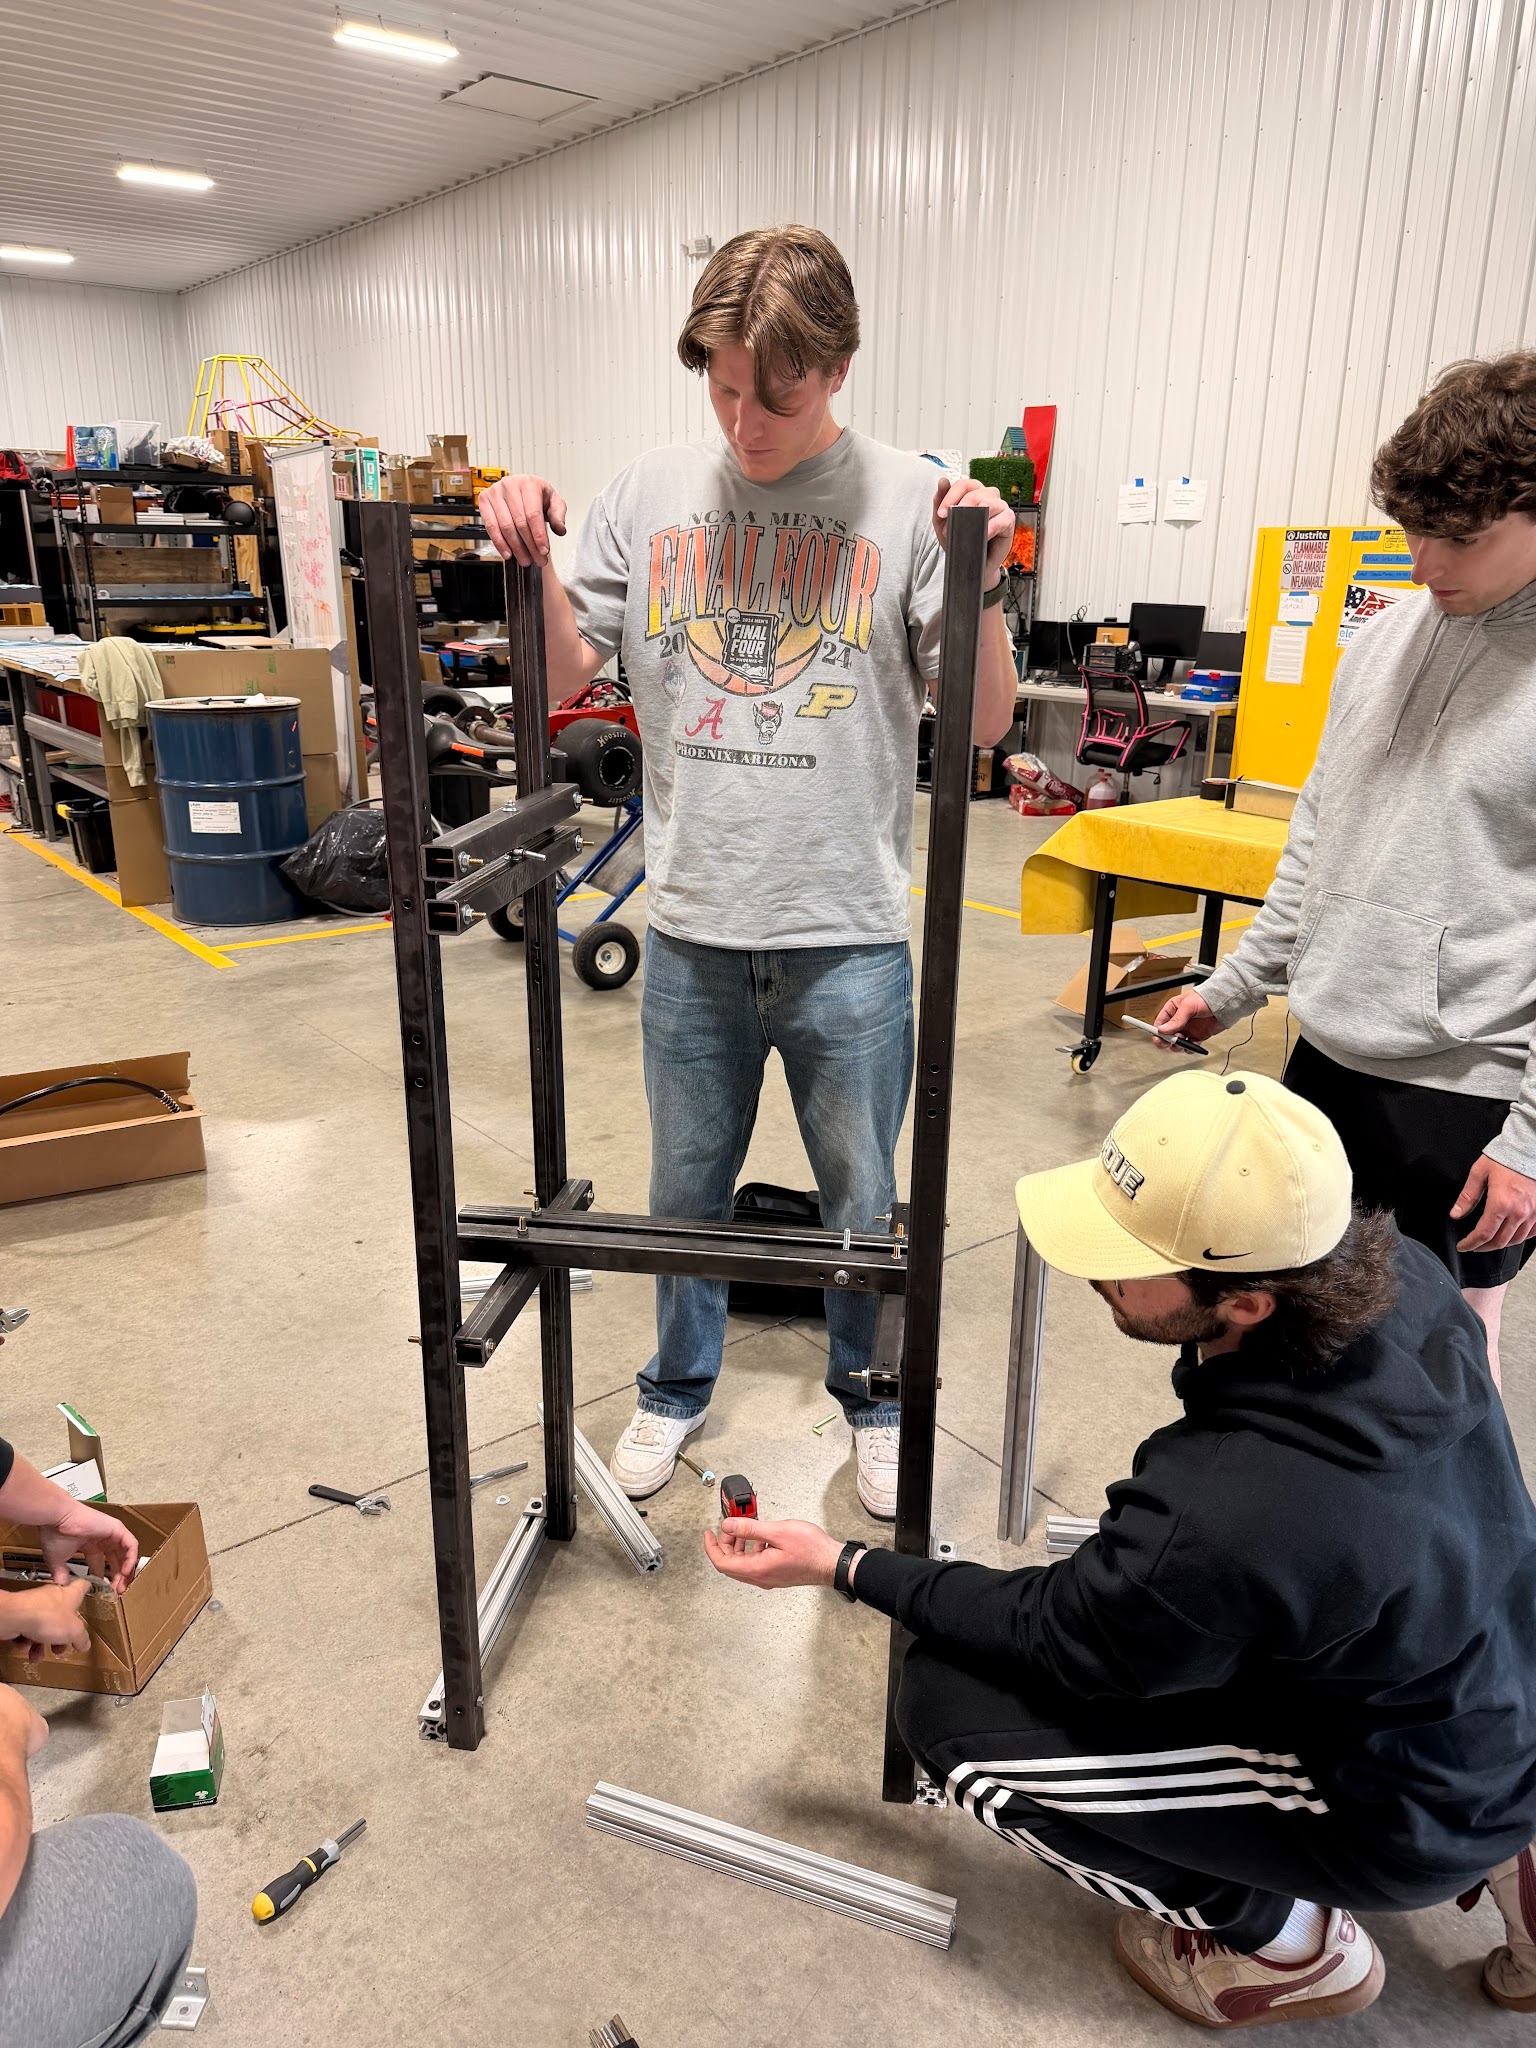
Construction on the frame went surprisingly well and without major issues. The steel frame tubes were cut and drilled in the machine shop. The mounting plate had thicker gauge steel so it was cut with the water jet and then other components were also welded together at Bechtel Innovation Center on campus. 8020 steel extrusion was used at the bottom of the frame to provide extra stability and polycarbonate sheeting to protect any bystanders in case any parts broke during testing.
An unfortunate side effect as we continued building the frame was that it became incredibly heavy (250-300 lbs). Since we were building it at the car testing facility we had to carry it up a flight of stairs when not in use. That part in particular was not a fun experience.
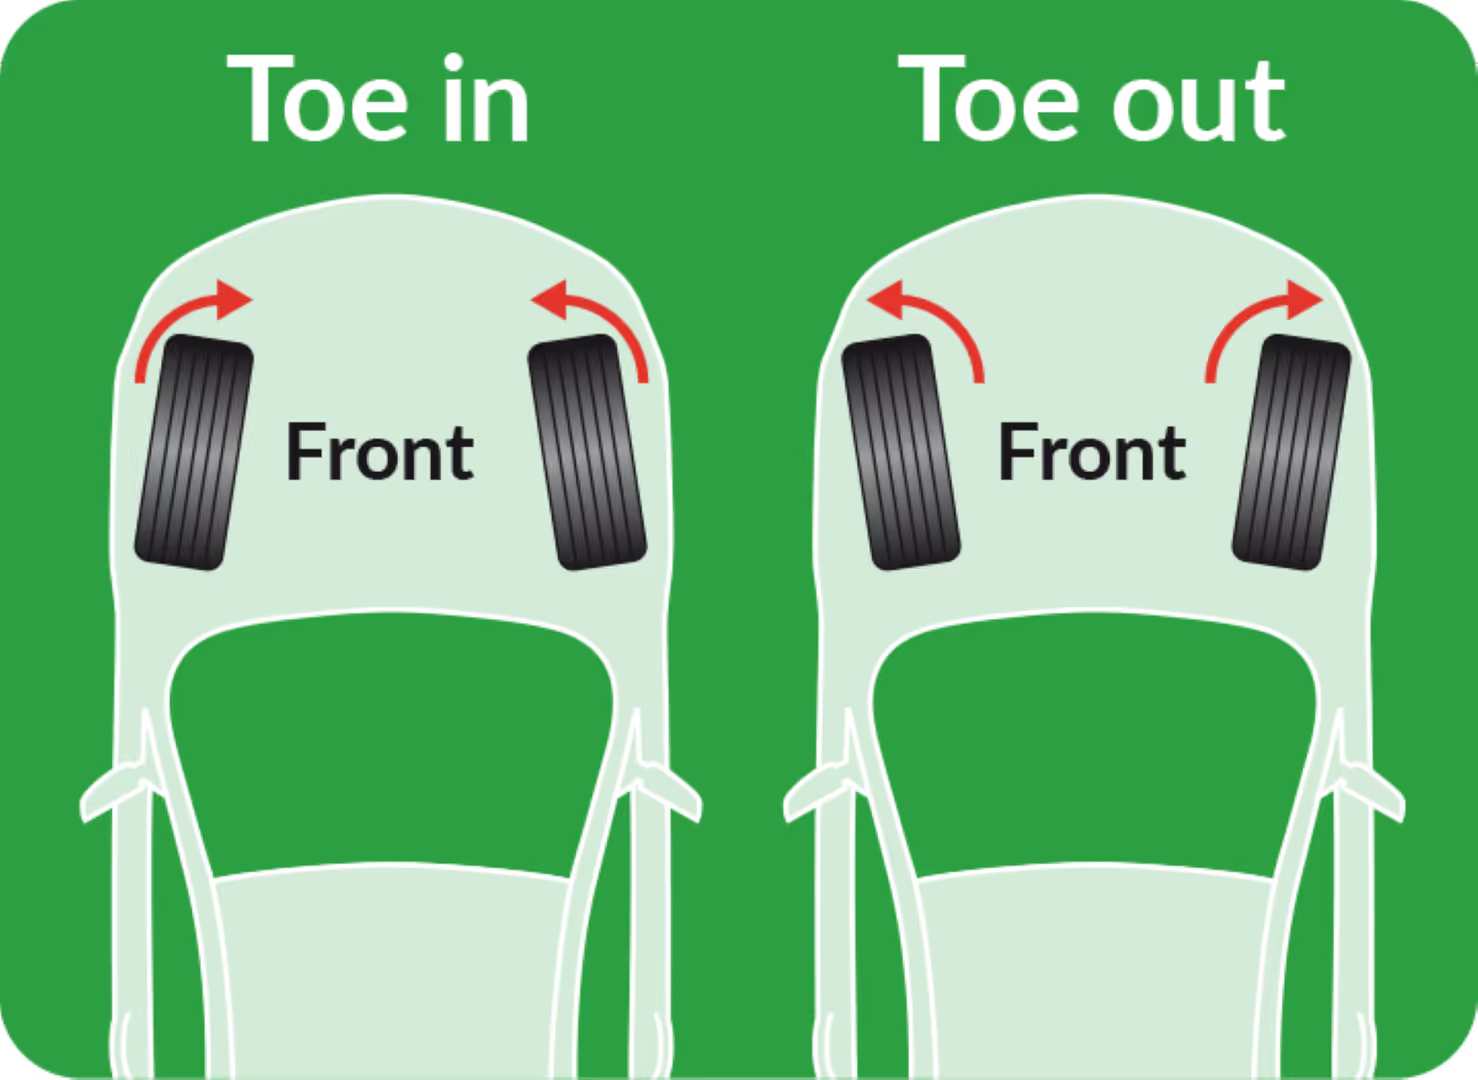
To measure deflection of the wheel hub during testing, we added in two dial indicators to track the toe and camber angles. These angles are important because they have a critical impact on the car’s performance and so are valuable to measure during testing. Toe angle is the inward/outward angle of the wheels when viewed from above and helps control car steering on sharp corners. Camber angle is the vertical tilt of the wheel when viewed from the front. A negative camber is ideal as it guarantees the tire’s remains flat against the ground during sharp turns, maximizing grip and thus acceleration.
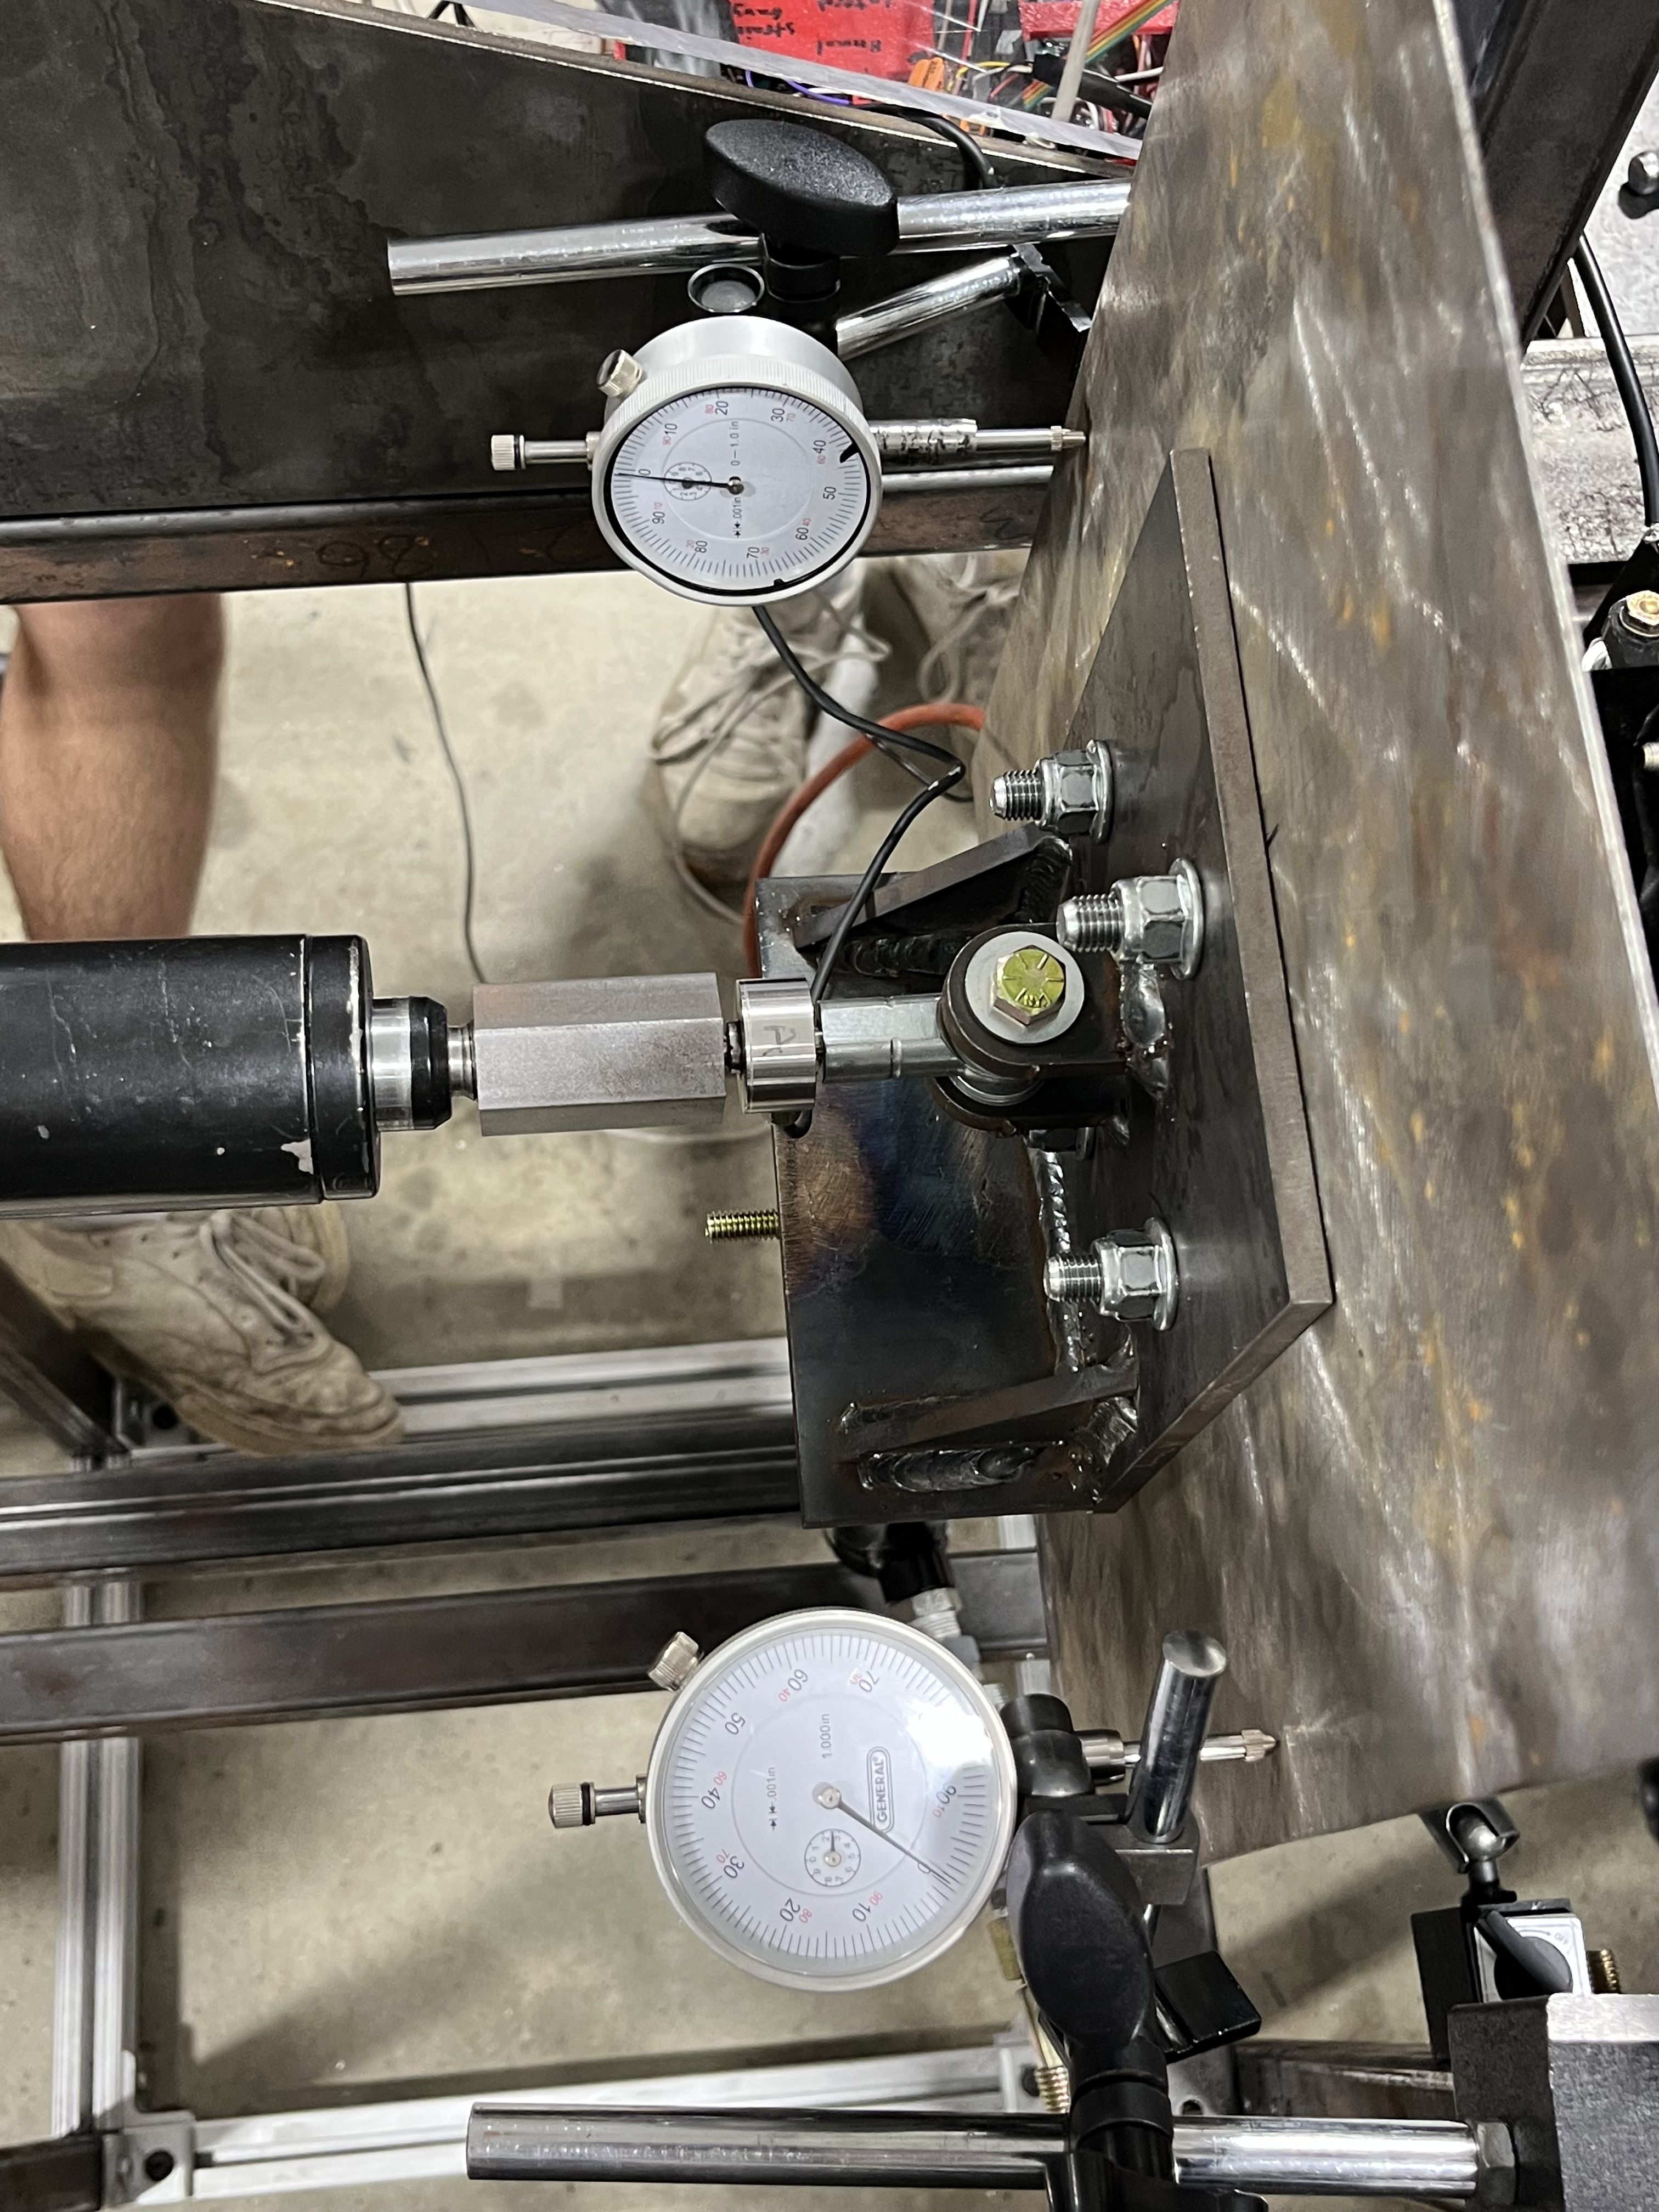
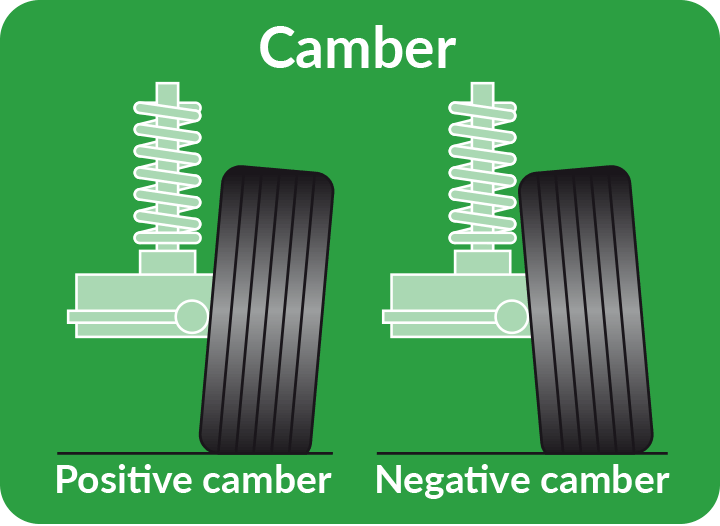
While testing the rig on the car, these angles showed desired results as the toe angle didn’t change significantly and the camber angle became more negative as load increased.

Build/Test Phase – Electronics
Building and designing the circuit for this project was a very informative experience and one where I learned a lot. But, as it usually goes, this learning came as a result of a frustrating amount of trial and error and many long hours spent splicing wires, inhaling soldering fumes, and burning my fingers.
I validated the load cells using the Universal Testing Machine (UTM) in the Purdue ME materials testing lab. The load cells provide a raw voltage output read by the Arduino. This allowed us to find the exact calibration factor to connect that voltage to a value in Newtons. To do the test I used two of our custom steel adapters that screw directly onto the load cell. Then I applied a known force on the cell in compression and mapped it to a custom Python testing script to find a linear regression average for the resulting calibration factor.


The strain gauges were a bit of a difficult challenge. They kinda worked (not really, I’ll talk about that more in the results section). To accurately measure strain in a bending cylindrical bar and remove any variability due to temperature fluctuation, we attempted a full Wheatstone Bridge setup. Using two dual-axis strain gauges, the theory was that we could glue them on opposite sides of the bar so when the suspension member was bending, any temperature offsets would be counteracted by the opposing gauge.
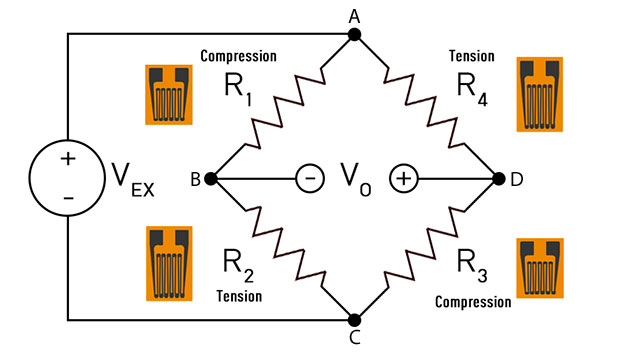

I did a bunch of hand calculations to get approximate voltage change numbers as well. This is a great idea in theory, but as I will discuss later, a ton of other issues arose on our way to doing this and we were unable to get it to function well in our testing.

The circuit box started out very neat but ended up as a bit of a mess. But more importantly it worked (mostly)!! I used WAGO connectors for the load cells and strain gauges to allow them to be detached easier in case of any future maintenance. The electrical tape on the box holds wires in place to prevent them from disconnecting from the chips if any of them are pulled on accidentally.


Using an extra sheet of polycarbonate sheeting we also built a little table on the side of the test rig to hold this circuit box and a space for a laptop to run a user interface during testing.

While building the electronics hardware was a difficult and rewarding experience, my favorite part of the project was a custom python user interface I built. It started off as an idea I had when testing the individual sensors. The original plan was just to read the values from the Arduino serial monitor when it would be plugged into a laptop during testing. But I asked the question to myself, “What if it was colorful? What if it had nice live updating graphs? What if it could export testing data into a nice .csv file for future analysis?”
I’m happy to say it ended up being able to do all of these things! This was heavily inspired by my summer 2025 intern project where I created an AI quality inspection system that had a custom interface on a Raspberry Pi screen. In contrast, the Arduino didn’t have a screen we could use so instead it runs as a python script on a laptop. The final product was just as over-engineered as the circuit box. It has a Purdue-themed color scheme with live updating graphs, color changing buttons, and stakeholder logos. The user can also zero sensors, start and stop testing, and then export that testing data as an Excel .csv file. I do have a lot of Python experience and so although much of this code was generated with the Gemini Pro model (works great for making interfaces like this) I had to manually debug (so much) to get it to work as desired and not crash constantly or have a bad end experience for the user. It only updates about twice a second (2 Hz) since pumping the hydraulic cylinders to the desired forces often took several minutes.

Results & Comments
Truly the only thing that didn’t work with our final design was the strain gauges (you may have noticed the odd looking graphs in the UI image before this). There are a lot of excuses to turn to for this, namely complex setup, shipping delays, and a conductive metal coating on the suspension members that caused the strain gauge leads to all connect to each other. All that being said, I think we could’ve figured it out had there been more time to test. Unfortunately due to the busy schedule of our team members, coordination issues with PER team, and the abruptness with which the semester ended after spring break, we only had one day to really set up on the test rig and use it on the PER car. While this worked great for our actuators, load cells, and dial indicators, it left only about 20 minutes to glue strain gauges to the suspension members and then connect them to the circuit. This proved to be an insufficient amount of time. I’m very hopeful the PER team can figure it out for next year though as they have used plenty of strain gauges in the past, the wiring is set up correctly in the circuit box, and the code is already set up to handle the 6 gauges with live updating graphs. I spoke with one of their project leads at a block party shortly after our project ended and he seemed pretty confident he could do it.


While I originally felt this problem was quite niche for a senior capstone project, it ended up being a great culmination of all the different things I learned throughout my undergrad degree as well as plenty of new skills. It combined a ton of mechanical design, static stress analysis, and CAD while also giving the opportunity to learn how to create a circuit component box and design interactive software. Really the best part was it actually worked for the most part and will continue to be used by the team for years to come (hopefully). To help future use of the Python software and any wiring issues, I created a GitHub repository containing all of the relevant code, detailed set-up instructions for both Windows and Mac, and documentation for the test rig.

Here is the video one more time if you want to watch it again after reading all about the project!
And then here is our presentation poster…

